The gist for this namespace can be found here.
You can download a workbook containing the sample data (sulphates column from Kaggle wine quality dataset), the LAMB namespace, and the OUTLIER namespace here.
The goals
This is the second of a two-part blog post covering some work I’ve been doing to update and improve some functions to assist with outlier detection.
Both posts are a follow-up to a post I wrote in April 2022. If you’d like to read some of the reasoning and background as to why we would bother creating functions for outlier detection, please read that post first.
For background information on this re-work exercise more generally, and for details about the supporting functions in the LAMB namespace, please read this.
- LAMB – this will be a namespace for functions that will support the second namespace.
- OUTLIERS – this is where the main testing functions will be.
This post will cover the second namespace – OUTLIERS, and the goals will be to:
1. Update the OUTLIER.THRESHOLDS function to take advantage of VSTACK
2. Update the OUTLIER.TEST function to take advantage of VSTACK, HSTACK as well as a few other changes
3. Update the OUTLIER.TESTS function to take advantage of the improvements discussed in the previous blog post regarding the LAMB namespace
4. Add a variant of OUTLIER.TEST called OUTLIER.CHART, the intention of which is to be able to quickly overlay outlier values in a chart series alongside the original data
1. Update the OUTLIER.THRESHOLDS function
If you decide to import the gist, please note that it should be imported to a new namespace called OUTLIER. For a quick primer on namespaces, read this.
/*
Author: OWEN PRICE
Date: 2022-08-27

Creates a single-param lambda using the supplied value of stddevs

e.g. Create a lambda function for calculating outlier thresholds
which uses 2 standard deviations as the cut-off point.

=outlier.thresholds(2)

And to use that lambda function with a vector v:

=outlier.thresholds(2)(v)

*/
THRESHOLDS =LAMBDA(std_devs,
    LAMBDA(vector,
        LET(
            _v,FILTER(vector,NOT(ISERROR(vector))),
            _fn,LAMBDA(i, AVERAGE(_v) + i * std_devs * STDEV.S(_v)),
            VSTACK( _fn(-1) , _fn(1) )
        )
    )
);
This function takes 1 parameter:
- std_devs
The argument passed to the parameter is used to configure the embedded LAMBDA _fn.
...
_fn,LAMBDA(i, AVERAGE(_v) + i * std_devs * STDEV.S(_v)),
...
So, if std_devs = 3, then:
...
_fn = LAMBDA(i, AVERAGE(_v) + i * 3 * STDEV.S(_v)),
...
And calling:
=OUTLIER.THRESHOLDS(3)
LAMBDA(vector,
        LET(
            _v,FILTER(vector,NOT(ISERROR(vector))),
            _fn,LAMBDA(i, AVERAGE(_v) + i * 3 * STDEV.S(_v)),
            VSTACK( _fn(-1) , _fn(1) )
        )
)
This return value is itself a lambda function.
It takes one parameter:
- vector – which is just a column of data
The calculation is simple:
- _v – is those rows in vector which are not error values (FILTER NOT ISERROR)
- _fn – is the function to determine a distance of std_devs standard deviations from the mean, where i is a signed integer: -1 for subtraction from the mean and 1 for addition to the mean. Defined in this way, the output of the function is then just:
- VSTACK(_fn(-1) , _fn(1) ) – or put in other words, the two-row one-column array containing the lower threshold in the first row and the upper threshold in the second row.
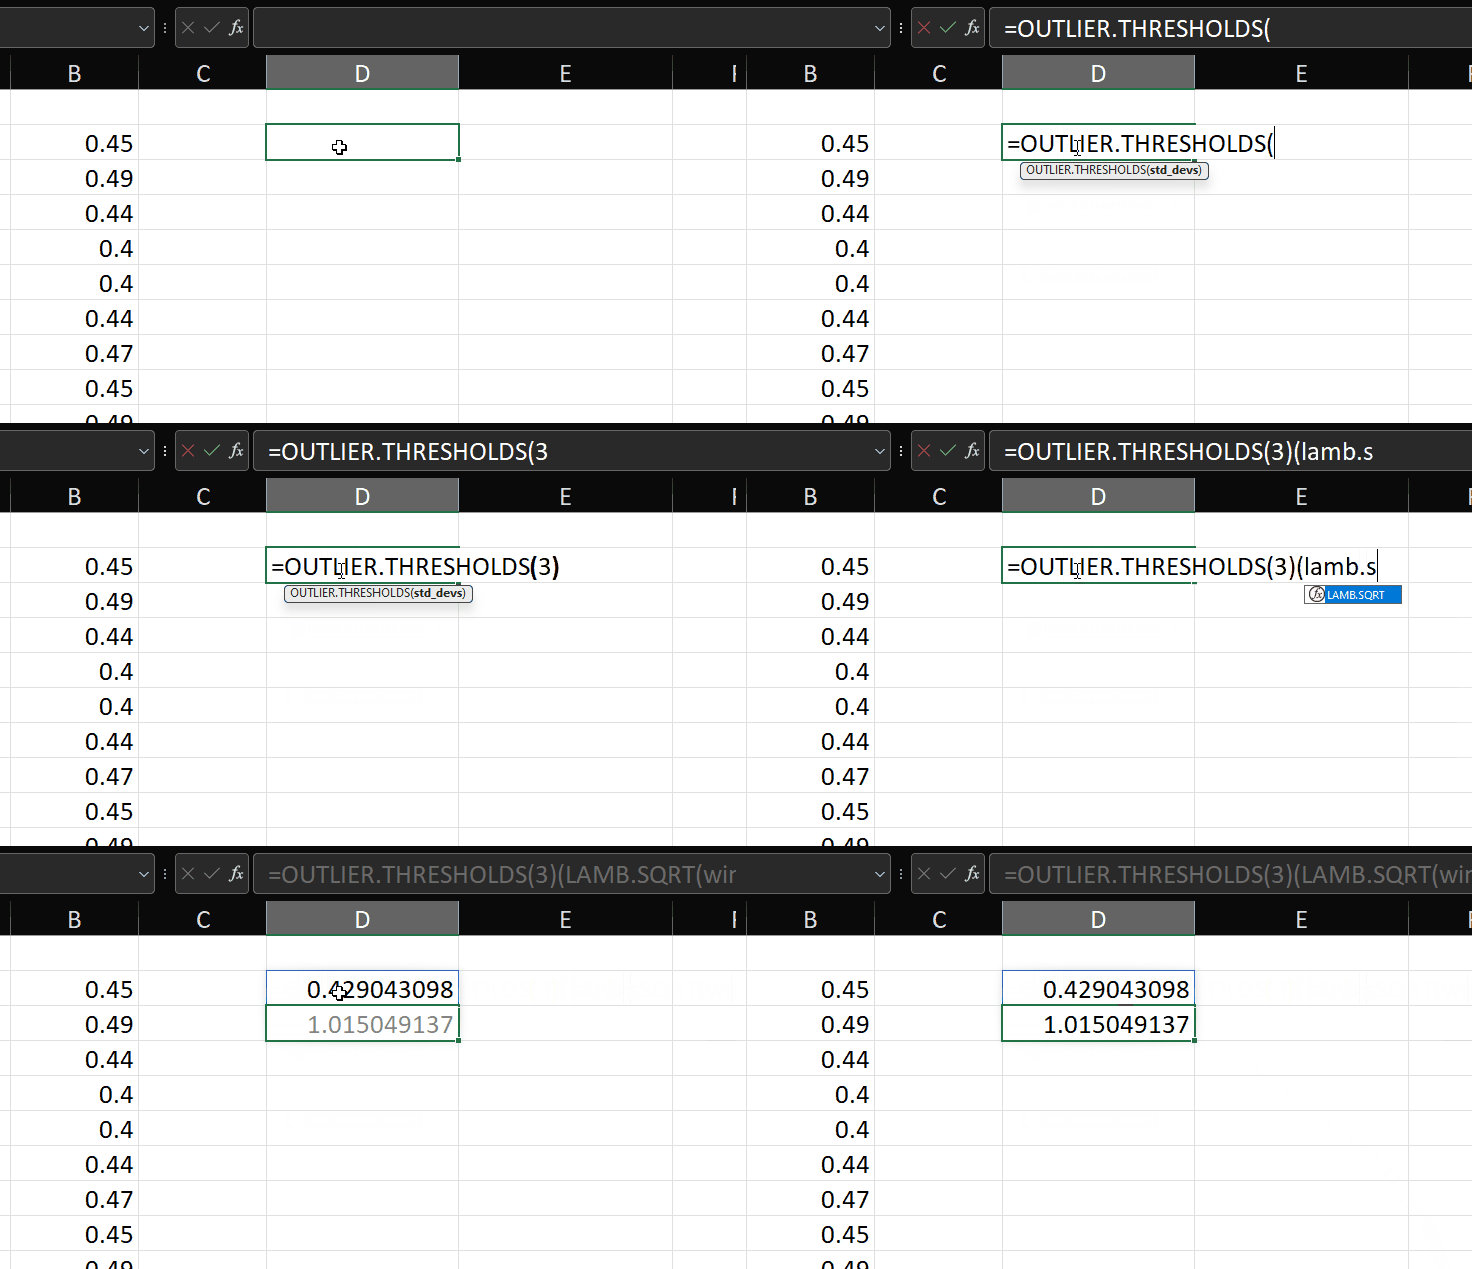
Now we have a function to calculate the outlier thresholds according to the test, we need a function to do something with that information.
2. Update the OUTLIER.TEST function
The purpose of the OUTLIER.TEST function is to run the so-called standard deviation test on a vector.
If you’d like to read more about why we would want to do that, please read the original post.
This is the OUTLIER.TEST function. Remember that the functions mentioned in this post are saved in the OUTLIER namespace, so in the code below you will only see the function name (e.g. TEST), but when you call the function in the workbook, you write =OUTLIER.TEST(…etc
/*
Author: OWEN PRICE
Date: 2022-08-27

Creates a single-parameter lambda that accepts a vector and outputs an array
of three columns:
1. [prefix]_data - The original data
2. [prefix]_is_outlier - boolean indicating if a row is an outlier
3. [prefix]_outlier_type - Text indicating if an outlier is either Low or High

e.g. to create a lambda with a threshold defined at 2 standard deviations from the mean
and whose output prefixes column headings with the word "wine"

=outlier.test(2,"wine")

And to then use that lambda against a vector v:

=outlier.test(2,"wine")(v)
*/
TEST =LAMBDA(std_devs,[prefix],[return_header],
  LET(
    _prefix,IF(ISOMITTED(prefix),"test",prefix),
    _return_header,IF(ISOMITTED(return_header),TRUE,return_header),
    LAMBDA(vector,
      LET(
        _data,vector,
        _thresholds,OUTLIER.THRESHOLDS(std_devs)(_data),
        _low,INDEX(_thresholds,1,),
        _high,INDEX(_thresholds,2,),
        _is_outlier,NOT(LAMB.BETWEEN(_low,_high)(_data)),
        _outlier_type,IFS( _data<_low,"Low" , _data>_high,"High" , TRUE,"" ),
        _header,_prefix & {"_data","_is_outlier","_outlier_type"},
        _output_no_header,HSTACK(_data,_is_outlier,_outlier_type),
        _output_with_header,VSTACK(_header,_output_no_header),
        IF(_return_header,_output_with_header,_output_no_header)
      )
    )
  )
);
This function accepts 3 parameters:
- std_devs – required – the number of standard deviations to use for the test. This value is passed into the OUTLIER.THRESHOLDS function as described above.
- prefix – optional – a text string to prepend to the column headers if preferred. If not provided, the default is “test”.
- return_header – optional – a TRUE/FALSE value indicating whether or not to return column headers from the test. Default is TRUE.
We begin with LET:
- _prefix – uses the ISOMITTED function to determine whether an argument was passed to the prefix parameter, then sets the default column prefix if the prefix argument is omitted.
- _return_header – again, uses ISOMITTED to check if the argument was provided, and if not, sets the default flag indicating whether column headers should be returned or not.
- The final “calculation” part of this LET statement is the creation of an embedded LAMBDA function.
    LAMBDA(vector,
      LET(
        _data,vector,
        _thresholds,OUTLIER.THRESHOLDS(std_devs)(_data),
        _low,INDEX(_thresholds,1,),
        _high,INDEX(_thresholds,2,),
        _is_outlier,NOT(LAMB.BETWEEN(_low,_high)(_data)),
        _outlier_type,IFS( _data<_low,"Low" , _data>_high,"High" , TRUE,"" ),
        _header,_prefix & {"_data","_is_outlier","_outlier_type"},
        _output_no_header,HSTACK(_data,_is_outlier,_outlier_type),
        _output_with_header,VSTACK(_header,_output_no_header),
        IF(_return_header,_output_with_header,_output_no_header)
      )
    )
The lambda returned by the OUTLIER.TEST function takes one parameter:
- vector – which is just a column of data
As usual, we use LET to define some variables:
- _data – this is just a shorthand locally scoped variable referencing the vector argument.
- _thresholds – we use the OUTLIER.THRESHOLDS function to return the lower and upper thresholds for outliers in this vector according to the test.
- _low – we use INDEX to extract the first row from _thresholds – this is the value below which a data point will be considered too low.
- _high – we use INDEX to extract the second row from _thresholds – this is the value above which a data point will be considered too high.
- _is_outlier – here we use the LAMB.BETWEEN function to return a vector the same length as _data, which is TRUE for data points between the thresholds and FALSE otherwise. Wrapping this in NOT inverts this, so that values between the thresholds are FALSE and other values (outside the thresholds) are TRUE.
For reference, this is the LAMB.BETWEEN lambda. This lambda sits in the LAMB namespace.
/*
Returns a lambda that itself returns TRUE if the vector value is >=gteq (the lower boundary)
or the vector value is <=lteq (the upper boundary)
*/
BETWEEN =LAMBDA(gteq,lteq,
  LAMBDA(vector,
    IFERROR(( (vector>=gteq) * (vector<=lteq) ) > 0, FALSE)
  )
);
Put simply, it takes two parameters – gteq (greater than or equal to) and lteq – with which is configures the return value – a lambda function of one parameter – vector. That return value compares each value in the vector with the outer parameters and returns TRUE or FALSE as described above.
Moving back to the OUTLIER.TEST lambda:
        _outlier_type,IFS( _data<_low,"Low" , _data>_high,"High" , TRUE,"" ),
        _header,_prefix & {"_data","_is_outlier","_outlier_type"},
        _output_no_header,HSTACK(_data,_is_outlier,_outlier_type),
        _output_with_header,VSTACK(_header,_output_no_header),
        IF(_return_header,_output_with_header,_output_no_header)
      )
    )
- _outlier_type – uses IFS to compare each data point in _data with _low and _high and returns a friendly text indicating what type of outlier we have, or an empty string otherwise.
- _header – here we prepend the prefix to some column suffixes describing the content of each output column.
- _output_no_header – we use HSTACK to horizontally join the three variables _data, _is_outlier and _outlier_type.
- _output_with_header – uses VSTACK to stack the _header on top of the _output_no_header.
- Finally, we check the _return_header variable to decide whether to return _output_with_header or _output_no_header.
So, that’s a lot!
This inner function is the return value of OUTLIER.TEST. As such, it’s called like this:
=OUTLIER.TEST(3,,FALSE)(wine)
Here, we want to:
- calculate outlier thresholds using 3 standard deviations from the mean
- skip the prefix parameter
- don’t return the column headers, and finally:
- apply the test to the data in the named range “wine”
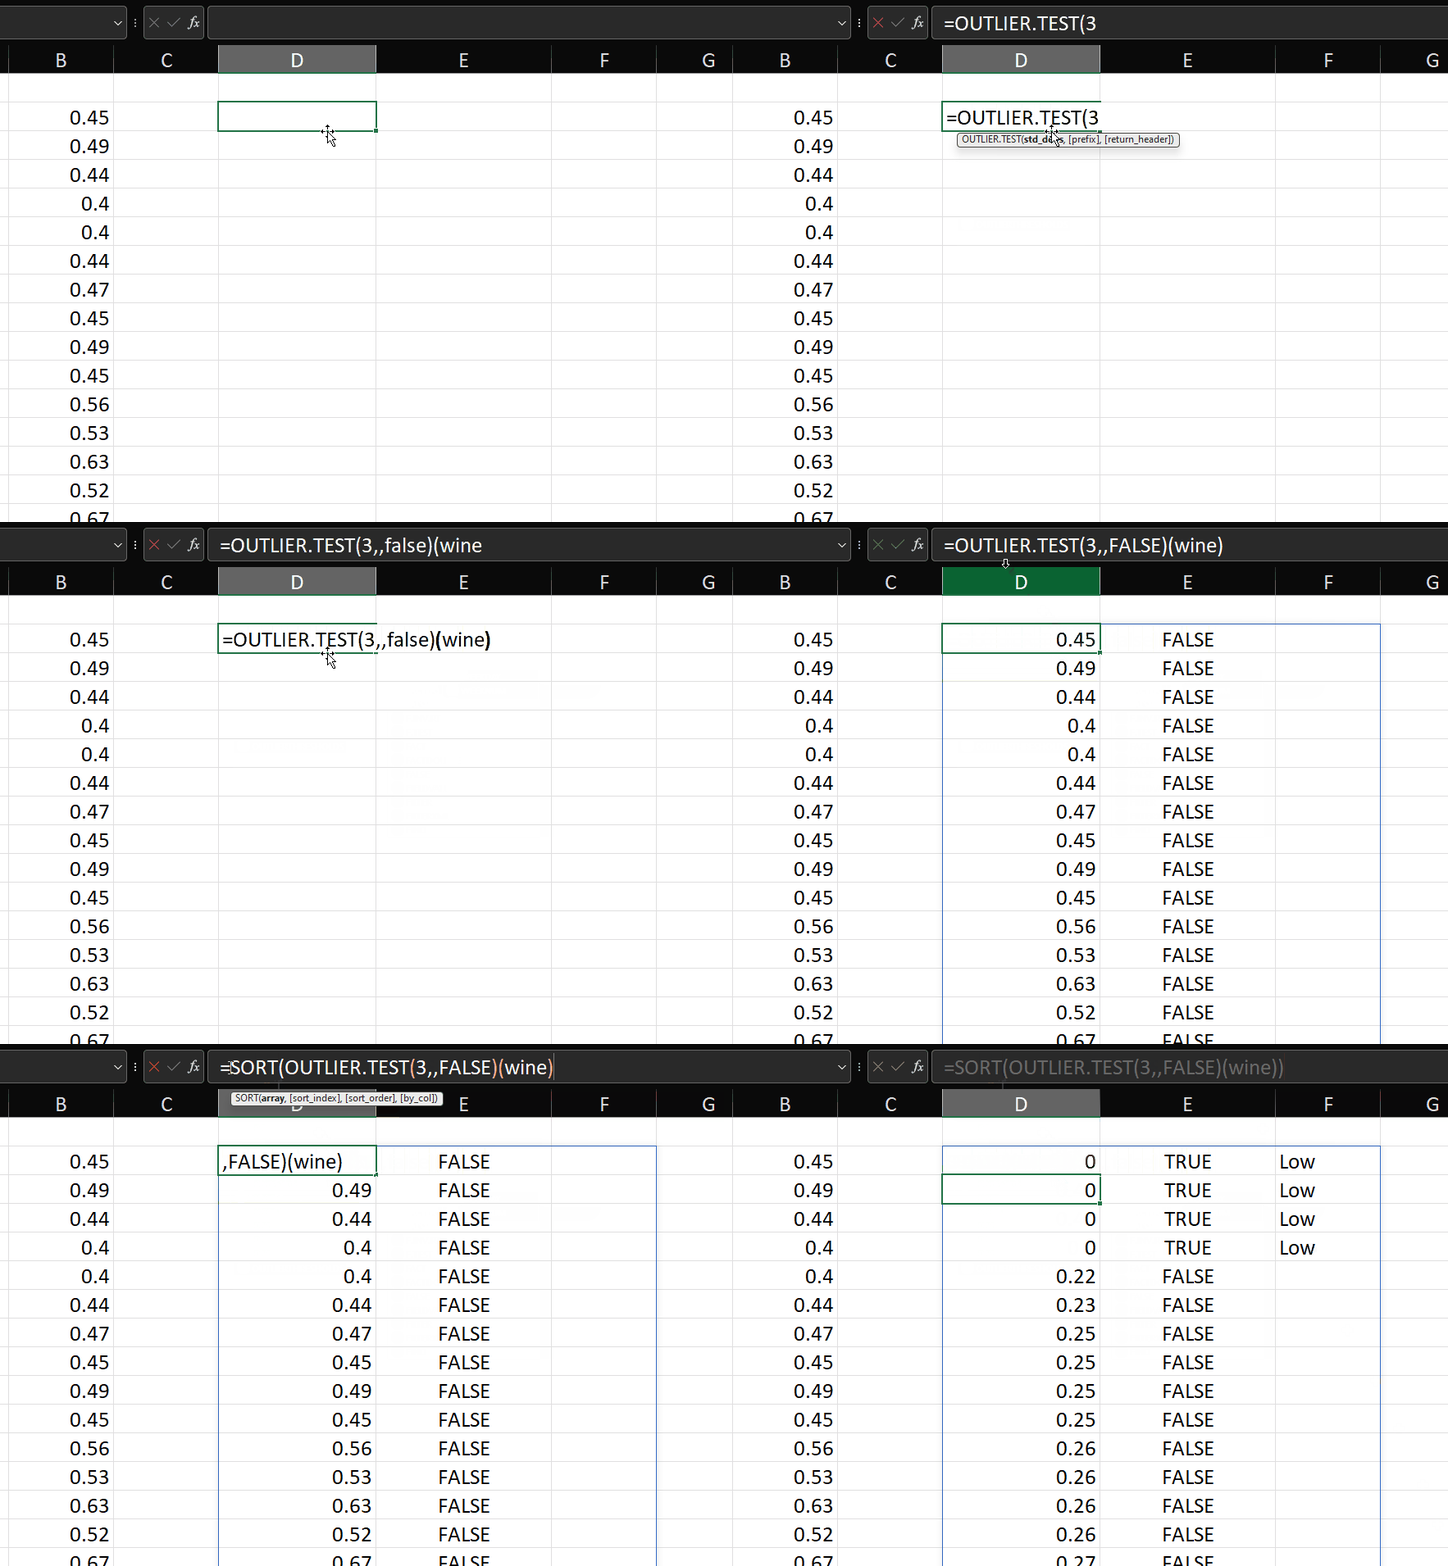
Nice! As mentioned in the original post, it’s probably useful to be able to apply this test to a transformed version of the variable. Say we want to transform using the SQRT function, then we can do this:
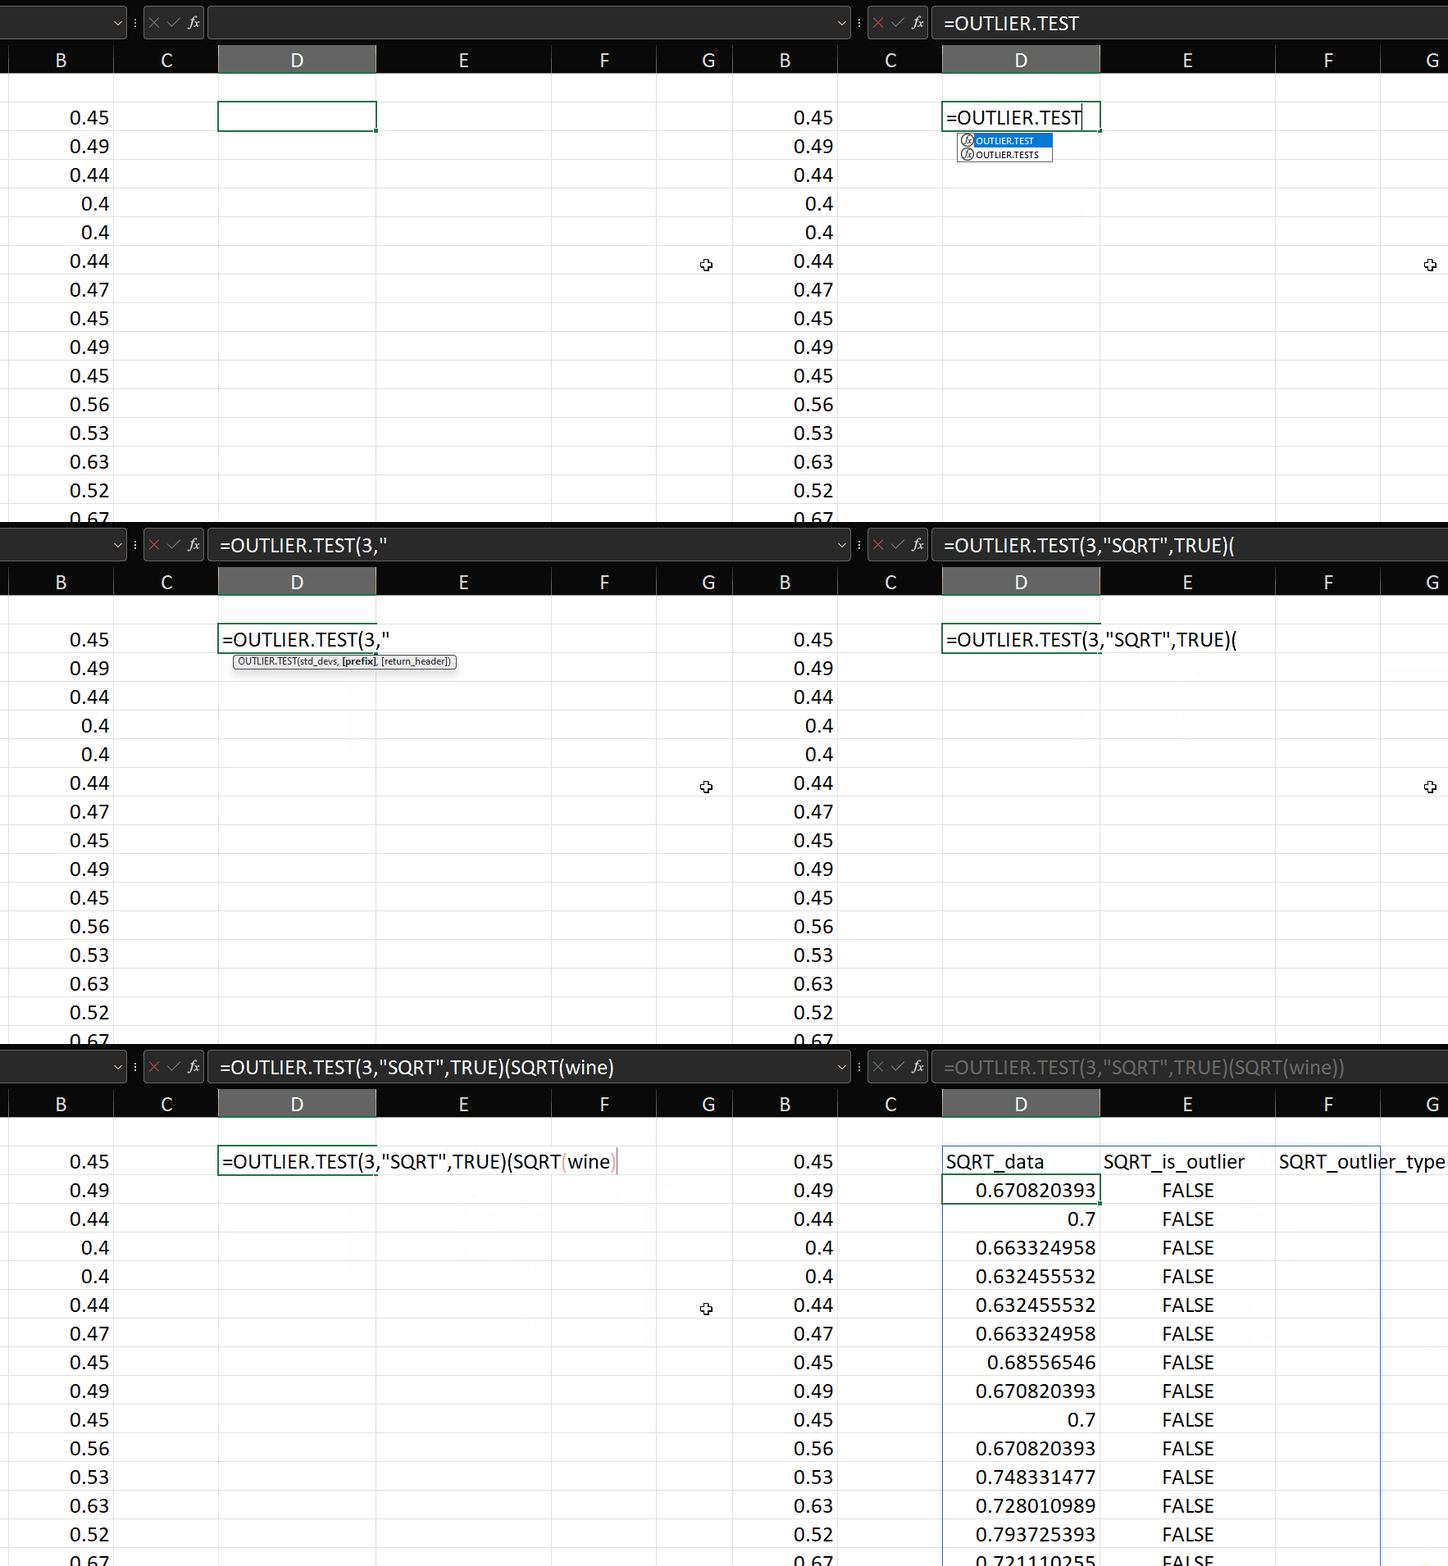
But what if we’re not sure which transform we want to apply?
What if we want to run the test for multiple transformed versions of the variable?
Well, that’s where we use something called OUTLIER.TESTS.
3. Update the OUTLIER.TESTS function
The purpose of the OUTLIER.TESTS function is to provide a convenient way to transform the input vector an arbitrary number of times and run the test on the result of each transformation.
It makes use of the functions from the LAMB namespace, described in the previous post. If you haven’t read that yet and want to have a solid understanding of what’s going on here, please read that post now.
This is the OUTLIER.TESTS function:
/*
Author: OWEN PRICE
Date: 2022-08-27

Applies a collection of transformation functions to a vector
and then applies a "standard deviation test" to each transformed vector

e.g. to transform the wine vector by SQRT and LN and test each using outliers outside 3 stddevs

=OUTLIER.TESTS(wine, 3, LAMB.FUNCS(LAMB.SQRT, LAMB.LN), "wine")

*/
TESTS =LAMBDA(vector,std_devs,transform_fns,[prefix],
  LET(
    _v,SORT(vector),

    _prefix,IF(ISOMITTED(prefix),"test",prefix),

    /*produces an array with ROWS(_v) rows and 1 + ROWS(transform_fns) columns
    the original vector is in the first column and each transform_fn constitutes an additional column*/
    _transformed, LAMB.TRANSFORM(_v, transform_fns),

    /*Returns a 'base lambda' configured with the std devs and column prefix' - this will be used for applying the tests to the various transformed columns*/
    _base_fn, OUTLIER.TEST(std_devs,_prefix),

    /*Now we just apply the base function to each column in _transformed and return the hstacked array*/
    _tested, LAMB.BYCOL(_transformed, _base_fn),

    _tested
  )
);
This lambda accepts four arguments:
- vector – a column of raw data which we want to test for outliers.
- std_devs – the number of standard deviations away from the mean to use as the thresholds for what is or is not an outlier.
- transform_fns – an array of transformation functions, as described in the post about the LAMB namespace.
- prefix – optional – a text string to prepend to the column headers of the output.
We use LET to define some variables:
- _v – here we sort the input vector so that the output array is also sorted.
- _prefix – uses the ISOMITTED function to determine whether an argument was passed to the prefix parameter, then sets the default column prefix if the prefix argument is omitted.
- _transformed – here we use the LAMB.TRANSFORM lambda, as described here, to apply the functions in the transform_fns array to the input vector. This operation produces an array with one column for the input vector and one column for each function in transform_fns.
- _base_fn – here we call OUTLIER.TEST without providing the input vector. As described above, the result of this function call is a lambda function of one parameter – vector. So, _base_fn is a lambda function which accepts a vector as its sole argument.
- _tested – here we use LAMB.BYCOL to iteratively apply the _base_fn lambda to each column in the _transformed array. Due to a limitation in how Excel’s native BYCOL function works (at time of writing), it’s necessary to use this custom BYCOL function. The native BYCOL will only return a single value per column. I will go into the detail of how LAMB.BYCOL works in another post since it’s probably too detailed to include here. For now, just know that _tested runs OUTLIER.TEST for each transformation function that was passed to the transform_fns parameter. The result is three output columns – one for each transform, stacked horizontally into an output array. For completeness, the test is also run against the original data.
This is how it works:
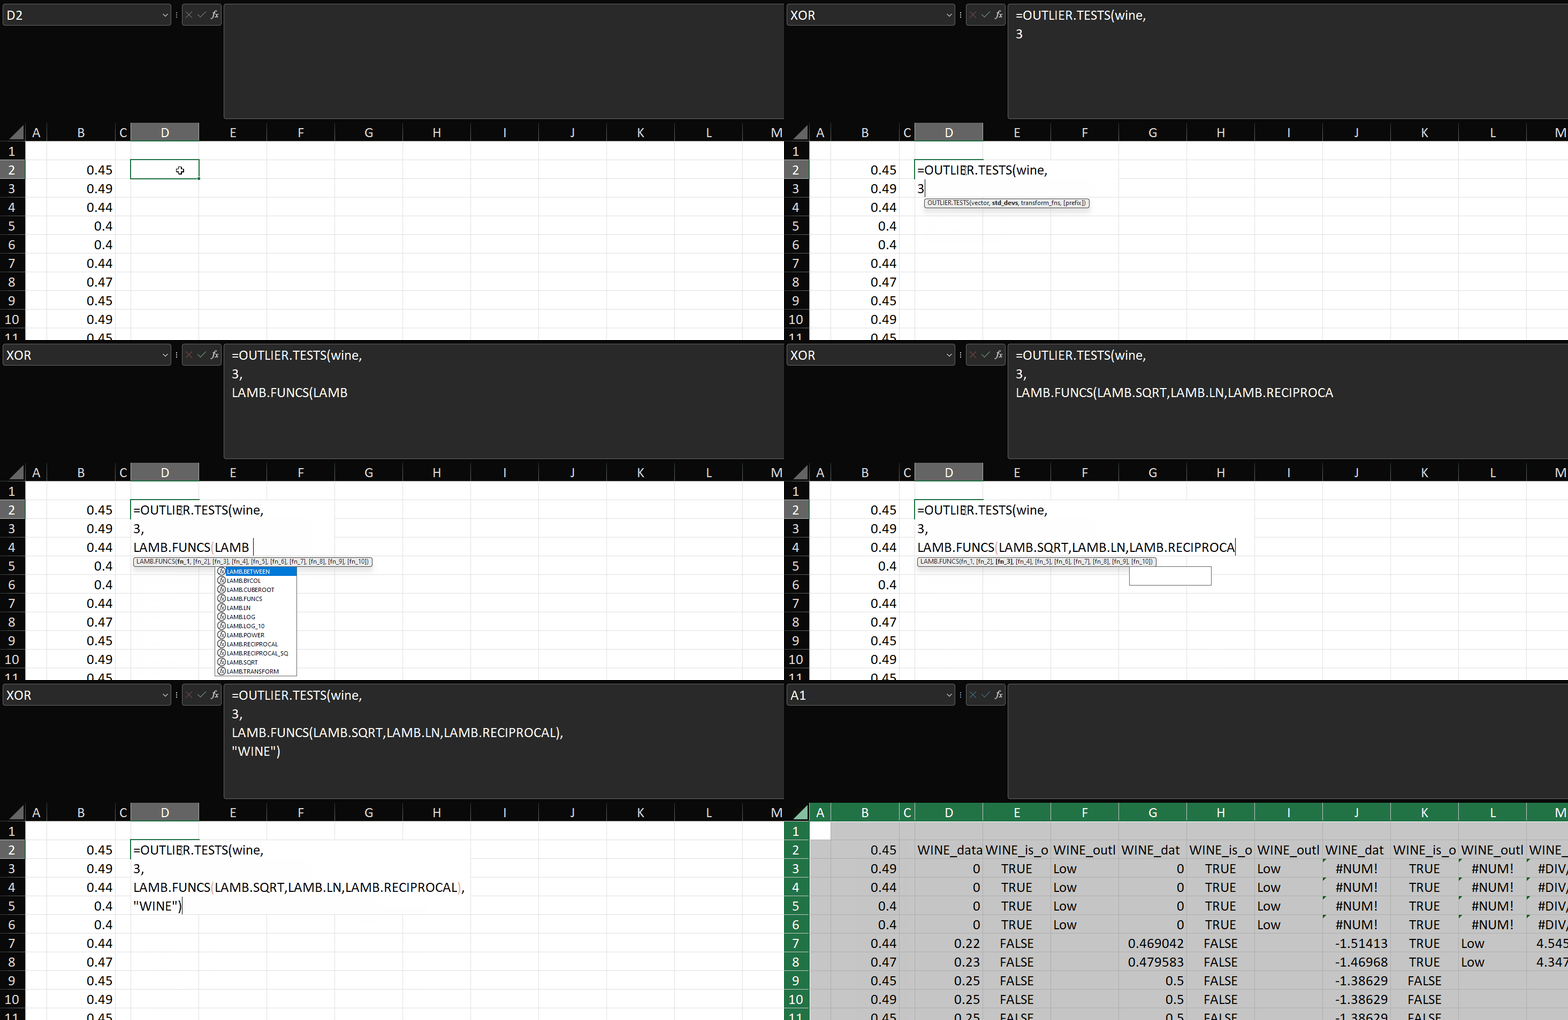
As you can see, since we can pass functions as parameters to other functions, it’s trivially easy to pass an array of transformation functions into OUTLIER.TESTS and have the main function apply those transformations to the input vector and return three columns per transformation.
It’s easy, it’s fast and it’s predictable.
One last function which I’ve added to the namespace which wasn’t there back in April is OUTLIER.CHART. Let’s see how that works.
4. Create an OUTLIER.CHART function
Here’s the code:
/*
Author: OWEN PRICE
Date: 2022-08-27

Creates a single-parameter lambda that accepts a vector and outputs an array
of two columns:
1. [prefix]_data_series - The vector passed into the function.
    The intention is to use this output column as a series in a chart.
2. [prefix]_outlier_series - if the function has identified a data point as an outlier,
    copy the value from the vector into this output column. If the data point is not an outlier, return NA().
    The intention is to use this column as a second series in a chart to allow the outliers to be in a different
    colour to the main data series.

e.g. to create a lambda for producing chart data with a threshold defined at 2 standard deviations from the mean
and whose output prefixes column headings with the word "wine"

=outlier.chart(2,"wine")

And to then use that lambda against a vector v:

=outlier.chart(2,"wine")(v)
*/
CHART =LAMBDA(std_devs,[prefix],
  LET(
    _prefix,IF(ISOMITTED(prefix),"test",prefix),
    LAMBDA(vector,
      LET(
        _data,vector,
        _thresholds,OUTLIER.THRESHOLDS(std_devs)(_data),
        _low,INDEX(_thresholds,1,),
        _high,INDEX(_thresholds,2,),
        _outlier,IF((_data<_low)+(_data>_high),_data,NA()),
        _header,_prefix & {"_data_series","_outlier_series"},
        _output_no_header,HSTACK(_data,_outlier),
        _output_with_header,VSTACK(_header,_output_no_header),
        _output_with_header
      )
    )
  )
);
OUTLIER.CHART works very similarly to OUTLIER.TEST, so I don’t intend to cover each step in the calculation in detail.
The difference here is instead of creating an vector of TRUE/FALSE and one containing “Low” or “High” we’re creating a vector called _outlier where, if the data point in the input vector is considered an outlier according to the test (i.e. it’s below the lower threshold or above the upper threshold), then that data point is displayed, otherwise the NA() value is displayed.
The result is a two-column array:
- The input vector with header “test_data_series”, which can be used to plot the input vector on a chart, and
- A vector showing values only for the outliers, with header “test_outlier_series”, which can be plotted as a separate series on the same chart, enabling the outliers to be formatted separately to the rest of the data.
It works like this:
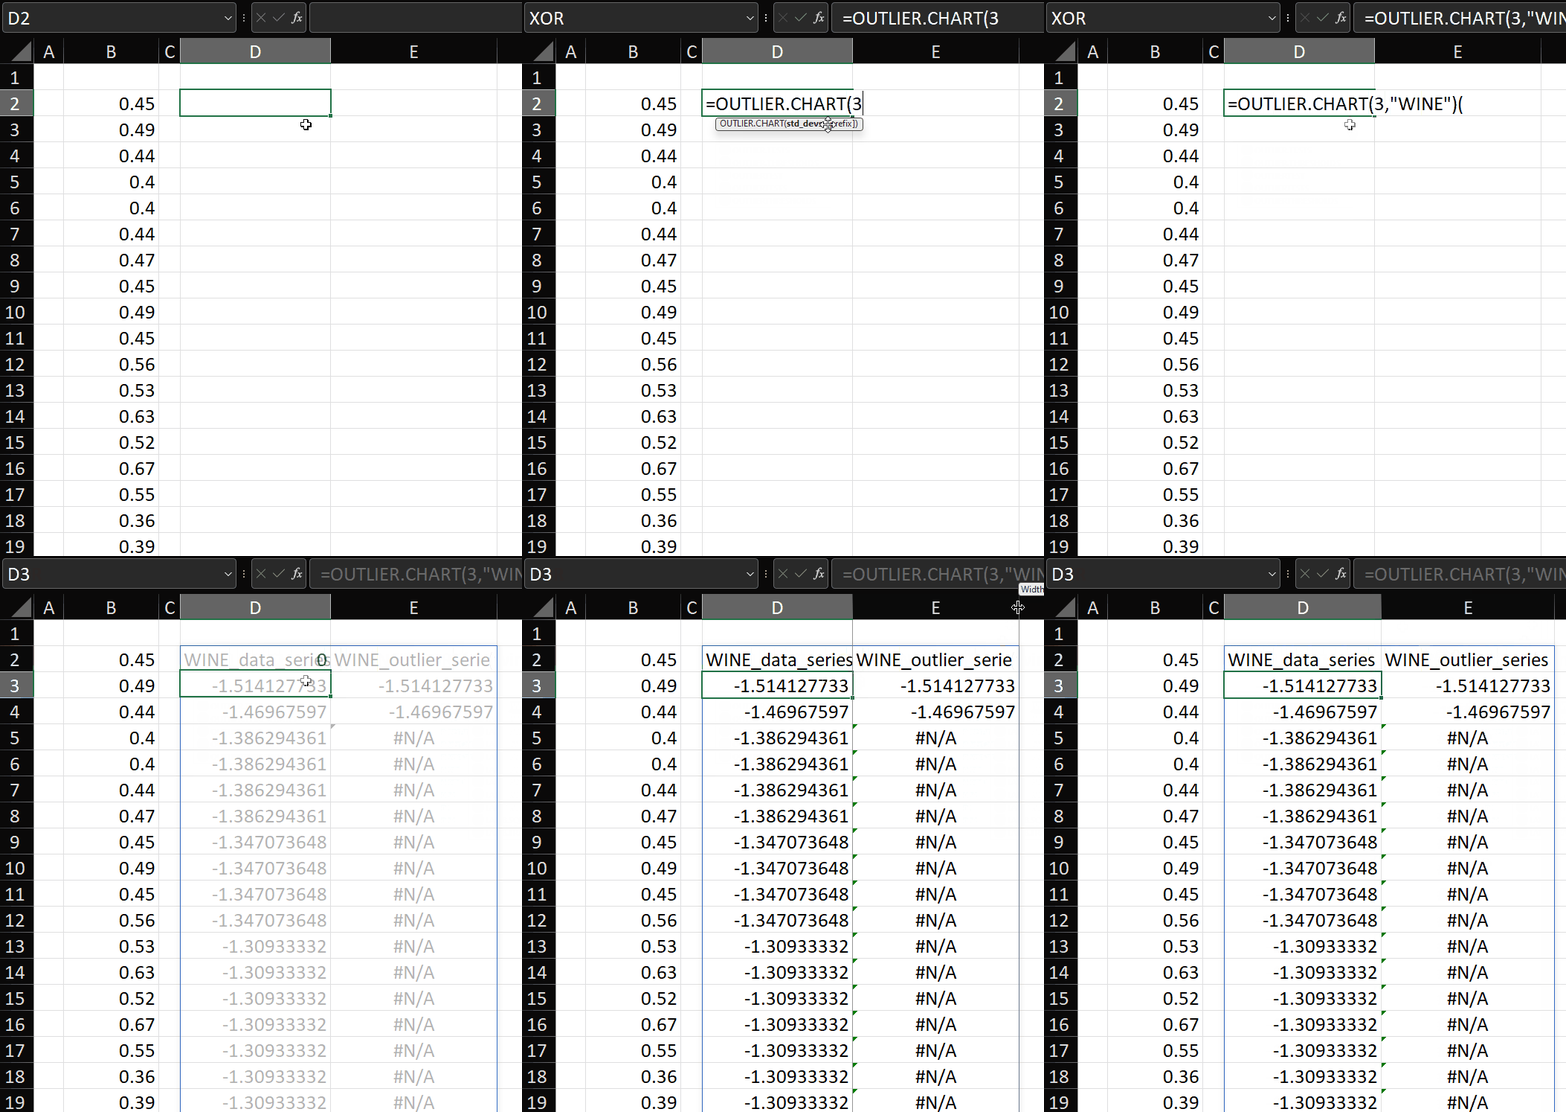
The first two parameters are passed to create a lambda which accepts the vector passed in the second set of parentheses. In the example above, I’ve just used SORT(LN(wine)) as the vector to be tested.
This OUTLIER.CHART function took less than 5 minutes to create, because the bulk of the code was already present in OUTLIER.TEST. Only the specifics of what columns were returned needed to be changed.
I think this is one of the main benefits of creating functions in this way – we can easily modify existing code to get what we want, and I encourage you to do the same.
No doubt what I’ve created here won’t be exactly what you need – but please do take what I’ve shared and modify it for your needs. If you have any questions or suggestions that might help others, please let me know.
In summary
We saw how to create outlier detection functions.
By using the LAMB namespace, including the techniques described in that post, we’re able to quickly pass an array of transformations into a function and iteratively transform, test, and stack the results of the test into a single output array.
I know this post was long and detailed, so if you’ve made it this far, then thank you for reading!
I will update and improve both LAMB and OUTLIER as ideas occur to me, so if you want to keep up to date on those changes, please consider following me on my gist home page and on linkedin, where I share data-related work on ideas I’m particularly excited about.
Carlos Barboza says:
This is brilliant at so many levels!
OP says:
Thanks, Carlos. I hope it’s useful. I want to do more with it to make it more useful for charting.